
An end of the year library report & why it matters

The title portion of my one-page poster. To make the poster, I used the Grey Book Library Sign poster design from Canva.com.
Since starting work in the middle school library, I’ve begun following basically every librarian I can find on Twitter. One of my more recent discoveries, Kelsey Bogan, tweets regularly (and maintains a blog!) about the various approaches she uses at her library to keep her students actively engaged and reading. Over the past few months, I’ve taken several of her ideas and tried them out in my school. (If you work in a library, and you’re on Twitter, I highly recommend following Kelsey. I’ve learned a ton about advocacy and boosting circulation from her this year.)
In late May, Kelsey tweeted about her one-page end of the year library report. She posted photos of the infographic in its digital form for sharing electronically with staff, students, and admin, as well as a photo of the infographic made up as a poster to display outside her library.
The teacher librarian at my school, Kristen, does an annual report every year for the administration and the district that describes the central role the library plays in our school community. Her report is very detailed, tailored to her audience, and an essential piece of advocacy, particularly when it comes to justifying budget requests.
But as a former marketer, I loved Kelsey’s idea of a simple one-page document that highlighted a few key facts that our community at large (students, parents, and teachers) would enjoy knowing, even if they didn’t know anything else about how the library functioned.
Many of Kelsey’s stats made sense to share with my community as well. Others I didn’t have enough experience as a first year library worker to speak to, so I either skipped them or swapped them out for ones that I suspected my audience would also be interested in. In this post, I’m going to talk about the 5 statistics I picked, why I picked them, and why I’m planning to keep doing this in the years to come.
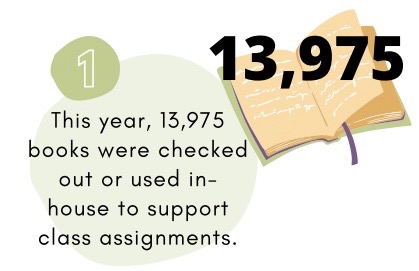
Key Fact #1: How many books were used this year?
The first question most people ask when they’re trying to figure out whether a library is being used is how many books were circulated in a given year.
In her EOY report, Kelsey includes circulation numbers for every year since 2016-2017. I chose to simply report this year’s total for a few reasons.
The first is that I wanted to include books used in-house in my total circulation statistics to get a more complete picture of how our collection is being used. This is the first year we have ever routinely tracked books used in the library. In the past, the library assistants simply tracked books that left the library (check-outs). I changed that this year because we have a large nonfiction weed coming up. Although we do have some students who read nonfiction on their own, by far the largest usage of our nonfiction section is to support class-driven research projects. Before we weed, we needed to be able to tell which books in our nonfiction section were still relevant to the school’s curriculum as it is currently being taught. Logging a book as used in-house whenever we pull books for a given class is a simple way to document that.
And yes, I know, I could simply exclude books used in-house from my circulation numbers, but that doesn’t solve the other problem. In 2016-2017, our student enrollment was 726. We started the 2021-2022 school year with 530 students. Comparing top line circulation numbers without providing that context is deeply misleading at best.
Kristen and I discussed the possibility of creating a chart that compared per-student reading numbers that would take into account enrollment changes. But we decided to go with just the top line number this year for simplicity’s sake. As a nice bonus, it gave us a design element for our one-pager that *wasn’t* a graph or pie chart.
Key Fact #2: What was the most popular book this year?
Over the year, I’ve learned that the easiest way to sell a student on reading a book is to point out that lots of their classmates have also read that book. Oddly, students aren’t as interested in whether Kristen and I read the book and liked it. Often, the single most powerful argument I can make in favor of a book is “I haven’t read this yet, but I’ve noticed that it is constantly being checked out.” So as soon as I saw that Kelsey had listed the year’s most popular books on her report, I knew I needed to include it on my report as well.
Kelsey had a tie for most popular book in her library, but in ours it was far and away Scythe by Neal Schusterman.

Key Fact #3: The number of books checked out through our Hold Shelf
I’ll be honest. I did this one for me. During the remote schooling phase of the pandemic, Kristen and her then Library Assistant spent a lot of time and effort training students to reserve books online and come pick them up using the library’s curbside pickup and drop-off service. Circulation numbers weren’t great last year, but there was a core group of students who used this service every week.
I was curious to see if there was real interest in a curbside dropoff and pickup like service once we were back in person. So I introduced a new Hold Shelf like the one offered by our local public library for students who preferred to — or only had time to — use our library that way. When it came time to do this report, I wanted to know whether that Hold Shelf was worth continuing.
Our library software tracks reserves, so figuring this out basically entailed asking the question. It turns out students reserved 730 books through that shelf.

That doesn’t sound like much, but when you realize that the 730 books that passed through the Hold Shelf represent roughly 8% of the physical materials checked out in 2021-2022, it starts to look more valuable. I would be interested to know what percentage of physical checkouts pass through the Hold Shelf at the public library, but that’s just sheer curiosity on my part.
At its current usage level, maintaining the Hold Shelf requires somewhere between 10-20 minutes of my time a day. In that time, I check the library software system for new reserves, retrieve the books from the stacks, print the reserve slips, stash the books on the shelf according to the student’s last name, and message the students that their books are ready. On Thursdays I’ll make a Reserve List sign to post outside the library listing the students who have books on hold and reminding them to come pick up their books before the weekend. On Monday mornings, I go through the Hold Shelf, and pull books with expired Holds and return them to circulation.
In exchange, I’ve noticed the students using that shelf in all kinds of unexpected ways. The most common use, of course, is the expected one: to join the waiting list to read popular books like Crush by Svetlana Chmakova or Six of Crows by Leigh Bardugo. Students also use it to reserve what I think of as overflow books, the next one or two books they want to read, once they’ve finished reading the books they have already checked out. I also have several students who use the Hold Shelf to stash books that they only want to read in the library for whatever reason.
Interestingly, I’ve noticed that some of our heaviest Hold Shelf users are students who frequently or almost exclusively read nonfiction. I may be reading too much into that, but I can’t help but wonder if that means that the Hold Shelf has a role to play in making our nonfiction section feel more accessible to readers. If true, that fact alone is enough to convince me to keep it. Over the year, several students who were initially described privately to me as reluctant readers revealed themselves to be dedicated nonfiction readers who simply needed to be shown how and/or where to find nonfiction books on the topics they were interested in.
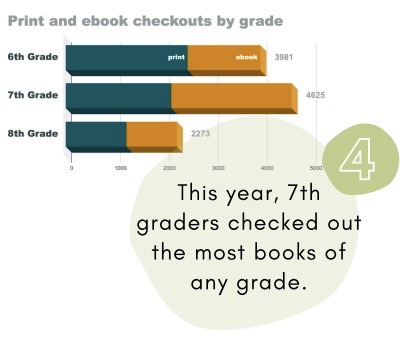
Key Fact #4: Which grade checked out the most books?
Kelsey also had this stat on her list. I can’t speak to her reasons, but in our case, it’s extremely useful. Our students are a competitive bunch, and a stat like this could easily encourage more checkouts next year.
This year, we had a mixed result. Sixth graders checked out the most print materials, but when you include ebooks, the seventh graders checked out more books overall. Sadly, the 8th graders aren’t reading nearly as much as the other classes. Perhaps we could figure out why and do some targeted interventions for 8th graders next year.
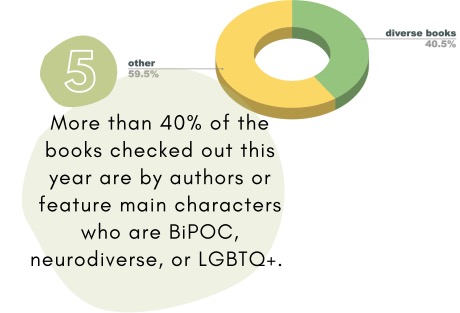
Key Fact #5: What percentage of our fiction checkouts were of diverse books?
Reading builds empathy. In order for that little trick to work, students need ready access to books that reflect their experiences (mirrors) and give them insight into the lives of other people not exactly like themselves (windows).
At my school, we serve a diverse mix of students from a wide range of economic and cultural backgrounds. Our district is currently auditing all of its school library collections to ensure that students have plenty of books that serve as both mirrors and windows. (Kelsey has a great post on her blog where she talks about how librarians who don’t have time to do a full diversity audit can reap most of the benefits of one with a fraction of the work.)
Curating the collection to include books that reflect our student’s experiences and build empathy toward others is important, but it’s only the first step. We also need our students to read those books.
This year, we invested a lot of time promoting a wide range of diverse books through bulletin boards, genre posters, reading lists, one-on-one conversations, front-facing books on our fiction and biography stacks, and topic-specific seasonal displays. We took a hard look at our series section, and swapped out some older series that were no longer being read with newer series from BIPOC or LGBTQ+ writers that could benefit from the added attention. Each month, I created a Google slides presentation highlighting select books from our new acquisitions, and ran it on a continuous loop on the TV mounted on the wall behind the circulation desk.
When I saw that Kelsey had included a statistic for the percentage of her checkouts that were diverse books, I decided that stat would be a good way to see if those efforts were having an effect.
I cannot tell a lie, that statistic took HOURS to compile. Although every book in our collection is tagged for easy searching of similar books, as far as I can tell, our library software doesn’t automatically include those tags in its circulation/checkout reports. I had to compile that information by hand. If I want to keep including this stat in the future, I have got to figure out an easier way.
Regardless, assuming I did all of that manual work correctly, at least 40% of the fiction books checked out from our library this year were either written by or featured main characters who were BIPOC, LGBTQ+, neurodiverse, or have physical differences. A good start.
Why spend all this time pulling together statistics for a one-page document that folks will skim in about 45 seconds?
I mean, Kristen puts all of this and more in her annual report right?
In my district, staffing and library resources are determined by enrollment. This is great when enrollment is rising, but enrollments are dropping across California. Our school, which is sized for more than 700 students, had a mere 530 students at the beginning of this past school year.
As regular readers know, I lived in Chicago before moving to California, and there I witnessed school library after school library being shuttered due to budget cuts. So far, that doesn’t feel like it’s on the table for our district, but at the same time there is dire talk around “adjusting library staffing to better align with enrollment.” Unfortunately, in practice this means that smaller schools in the district like ours will have relatively small staffs, and as a result, will be able to offer fewer library and other support services. And that means students zoned to attend those smaller schools will have less access to important reading, critical thinking, and research support due to circumstances entirely outside of their control.
You can see how this quickly becomes an equity issue. If you happen to live in an area zoned for one of our district’s smaller schools and your school’s staffing is cut to match enrollment, you will inevitably end up having less access to educational support services than other students in that same school district who happen to live in a neighborhood zoned for a larger school.
In this environment, it feels more urgent than ever to advocate for the library, its programs, and the staffing to support those programs to as many groups as possible in as many ways as possible. In an ideal world, funding and staffing would be decoupled from enrollment to some extent so that we can continue to provide critical library and reading support services in as equitable a fashion as possible.
Kristen’s annual report is designed for our administration and central district office to justify our annual budget, account for our expenditures, and to document the programs and activities driven through the library each year. It’s an essential piece of documentation, and well-targeted for its specific audience.
My one-page flyer was originally intended to entertain the students and partially compensate for the fact that the library itself was closed and they didn’t have access to the thing they really wanted … the books, the games, and the comfy chairs.
But it quickly became evident that there was a much larger audience for it. In the end, my one-pager with its 5 simple facts was posted outside the library for the students and other passers-by, emailed to the teachers and administration at our school, tucked in with Kristen’s annual report to the district central office, and emailed out to the parents in the final school e-newsletter of the year.
And, although we didn’t specifically send it to him, within 24 hours a copy of our fact sheet and annual report ended up in the hands of our district superintendent. That was pretty awesome, but also speaks to the clear need for school libraries to do this sort of facts-at-a-glance advocacy for themselves and their program.
Thank you, Kelsey, for the idea!
Related Links:
- Mirrors, Windows, and Doors (Rudine Sims Bishop)
- Kelsey Bogan’s Twitter feed and her blog, Don’t Shush Me
- Information Literacy Lost: Most CPS schools no longer have librarians (Chicago Tribune)

4 Responses to “An end of the year library report & why it matters”
[…] An end of the year library report and why it matters (Caterpickles) […]
LikeLike
[…] always, I’ll report back. At the very least, we’ll see in next year’s End of the Year Library Report, whether all this rearranging and showcasing actually does increase our circulation […]
LikeLike
[…] In the 2021-2022 report, I reported total circulation of 13,975. That number included both print and ebook circulation. […]
LikeLike
[…] At the end of my first year as Library Assistant at my public middle school library, I published an infographic with stats to give stakeholders a sense of how the students used the library that year. Total circulation, which grade used the library most, the year’s most popular book, that sort of thing. You may remember it, as I wrote it up here on Caterpickles (“An end of the year library report and why it matters“). […]
LikeLike